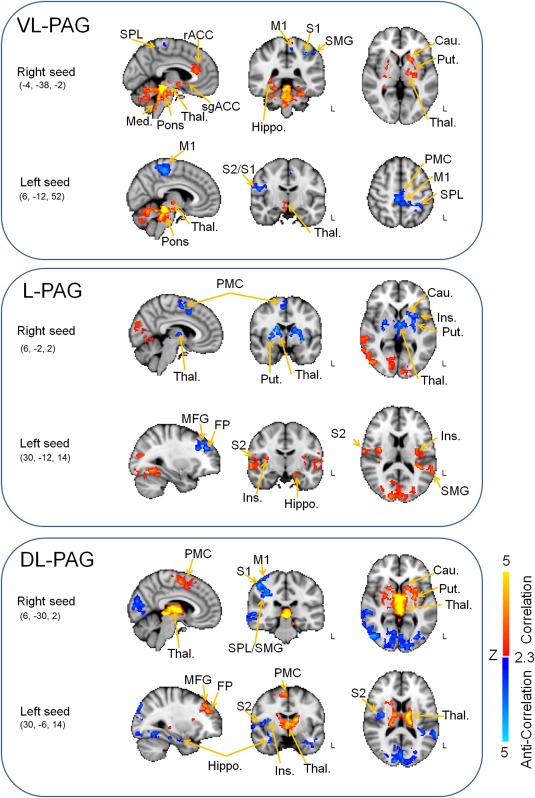
Figure 3.

(Anti)‐correlation maps of the seed‐based analyses using left and right ventrolateral (VL)‐, lateral (L)‐, and dorsolateral (DL)‐PAG 2 mm spherical seeds. Red–yellow render shows correlation maps of the seeds, while blue–light blue render shows anticorrelation maps of the seeds. All clusters are thresholded at Z = 2.3–5, P < 0.05. rACC, rostral anterior cingulate cortex; sgACC, subgenual anterior cingulate cortex; Cau., caudate; FP, frontal pole; Hippo., hippocampus/parahippocampal gyrus; Ins., insular Cortex; M1, primary motor cortex; Med., medulla; MFG, middle frontal gyrus; PMC, premotor cortex; Put., putamen; S1, primary somatosensory cortex; S2, secondary somatosensory cortex; SMG, supramarginal gyrus; SPL, supraparietal lobule; Thal., Thalamus. Coordinates are in millimeters.
