
Figure 5.
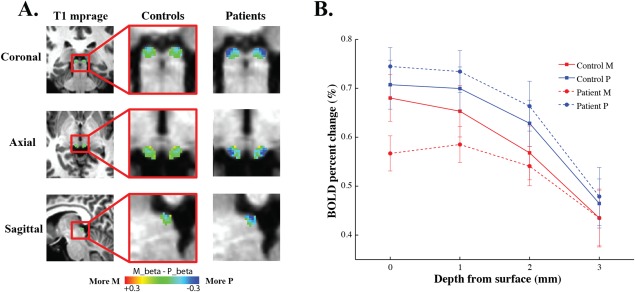
fMRI responses to the M and P stimuli in the SC of normal controls and glaucoma patients. (A) The M‐P beta maps in the SC. The left column shows the anatomical location of the SC in coronal, axial and sagittal planes of a middle section of the brain. The middle and right columns show the M‐P beta maps in the SC of normal controls and glaucoma patients, respectively. (B) SC responses to the M and P stimuli as a function of voxel's depth from the surface of the SC. Red and blue lines indicate response to the M and P stimulus, respectively. Solid and dashed lines represent responses from normal controls, and glaucoma patients respectively. [Color figure can be viewed in the online issue, which is available at http://wileyonlinelibrary.com.]