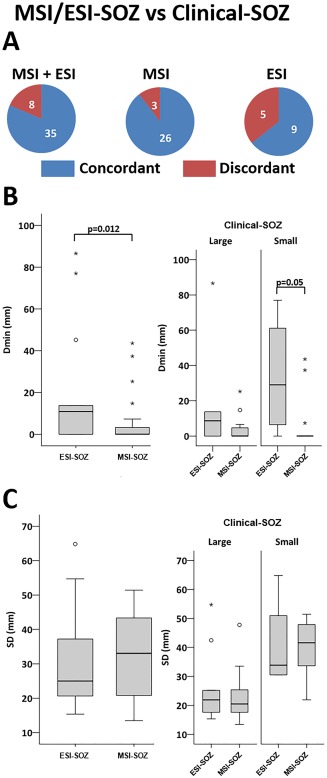
Figure 2.

Ictal MEG and ictal EEG in comparison with the true SOZ. A. Concordance at sublobar level vs clinical‐SOZ. The sublobar concordance between MSI/ESI‐SOZ and clinical‐SOZ was high (81%), ranging between 64% (ESI‐SOZ) to 90% (MSI‐SOZ). B. Boxplot distribution of Dmin comparing MSI‐SOZ and ESI‐SOZ. The minimum distance between the maximum of MSI/ESI‐SOZ and the clinical‐SOZ (Dmin) was lower for MSI‐SOZ. This difference was confirmed on the group of patients showing a smaller clinical‐SOZ (right panel). C. Boxplot distribution of SD comparing MSI‐SOZ and ESI‐SOZ. There was no difference in terms of spatial dispersion (SD) between MSI‐SOZ and ESI‐SOZ. Circles denote values that are farther than 1.5 interquartile ranges; starts denote values that are farther than 3 interquartile ranges. [Color figure can be viewed in the online issue, which is available at http://wileyonlinelibrary.com.]
