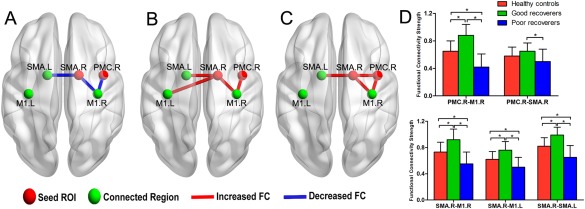
Figure 4.

Resting state functional connectivity differences among the three groups of participants. (A) Decreased functional connectivity in poor recoverers relative to healthy controls. (B) Increased functional connectivity in good recoverers relative to healthy controls. (C) Increased functional connectivity in good recoverers relative to poor recoverers. (D) Bar graph showing the fractional strength of the three groups at the peak of the abnormal regions. Abbreviation: SMA, supplementary motor area; M1, primary motor cortex; PMC, premotor cortex; FC, functional connectivity. [Color figure can be viewed in the online issue, which is available at http://wileyonlinelibrary.com.]
