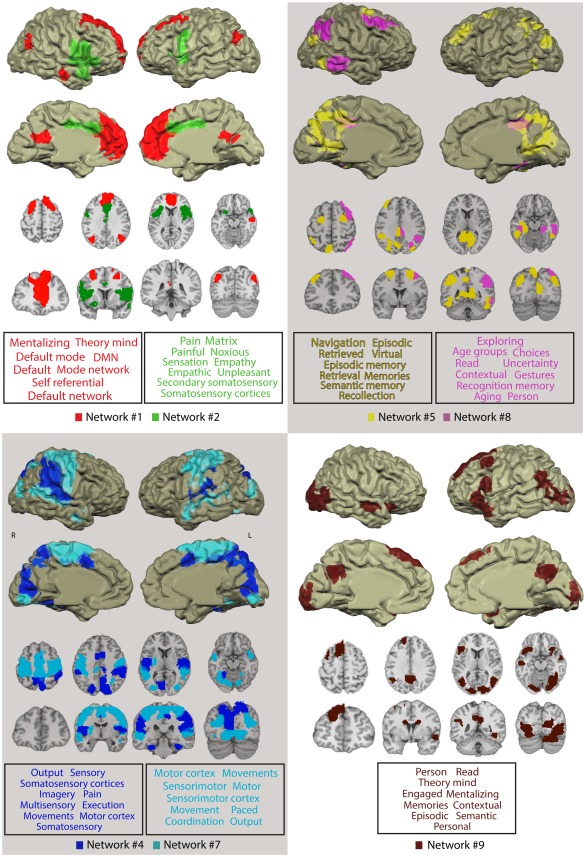
Figure 4.

Networks delineated by CRNDA whose NCI showed reliable correlation with the sadness intensity rating and their functional profiling. For clarity, we superimposed no more than two networks on each anatomical image. The font size in the word cloud is proportional to the average probability with which the term was assigned to peak voxels in the network by the Neurosynth database. Only the top 10 functional terms are visualized (for the entire list of 100 terms, see Supporting Information Table SI). [Color figure can be viewed at http://wileyonlinelibrary.com]
