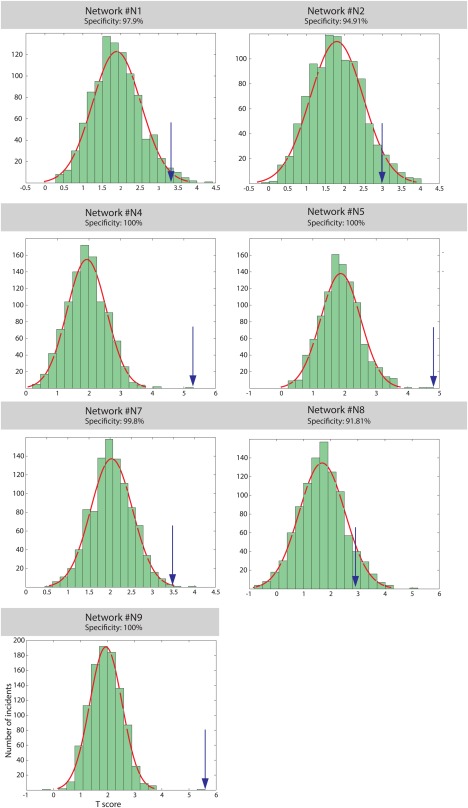
Figure 5.

Spatial specificity of the NCI‐rating link as indicated by a permutation test. The blue arrows indicate the t‐scores of the original networks relative to a histogram of t‐scores for randomized networks. [Color figure can be viewed at http://wileyonlinelibrary.com]
