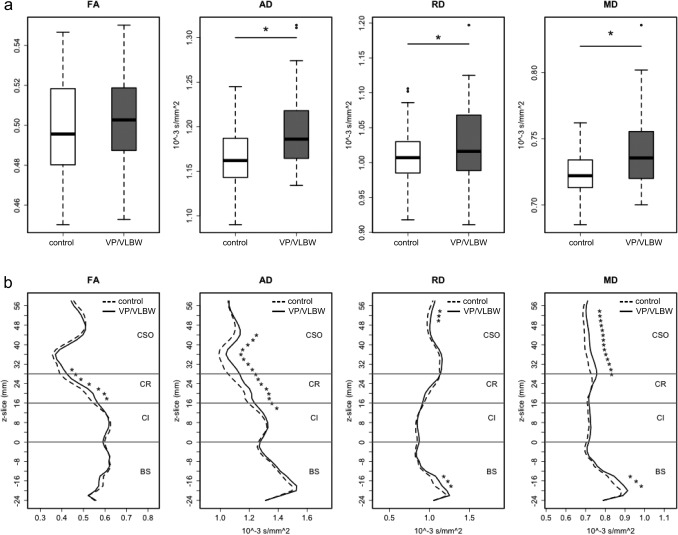
Figure 1.

Probabilistic tractography. Differences in diffusion parameters (FA, AD, RD and MD)—between VP/VLBW and control adults in the probabilistically tracked whole CST (a) and along the z‐axis of the CST (b). Approximate levels of the brain stem (BS), capsula interna (CI), corona radiata (CR) and centrum semiovale (CSO) are marked along the CST. Significant differences P < 0.05 are marked with asterisk; for comparisons along the z‐axis Bonferroni correction for multiple comparisons was used. Left and right CST are averaged.
