
Figure 1.
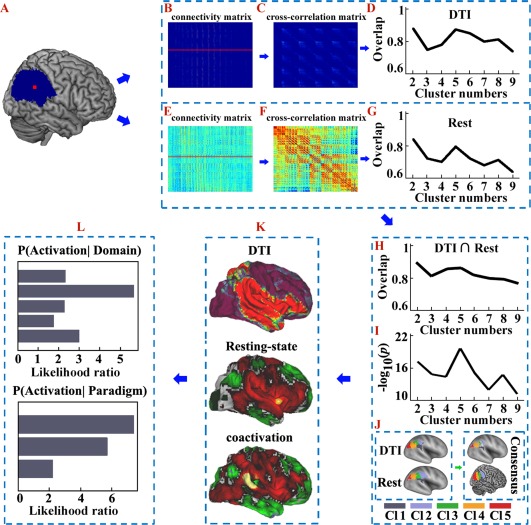
Overall flowchart of this study. A. The right inferior parietal lobule (RIPL) mask was defined by probabilistic cytoarchitectonic maps using SPM Anatomy toolbox. B. Probabilistic tractography was performed from each voxel in the seed area and yielded a connectivity matrix between all voxels in the seed mask and each brain voxel. C. These anatomical connectivity matrices were then used to generate a symmetric cross‐correlation matrix, which was then segmented for automated clustering to define different clusters/subregions. D. The overlap degree was calculated across all the subjects' parcellations at each cluster solution. E. The resting‐state functional connectivity (RSFC) between each voxel in the seed area and each brain voxel was calculated to obtain a functional connectivity matrix. F. These RSFC matrices were then used to calculate a symmetric cross‐correlation matrix using eta2. G. The overlap degree across all the subjects' parcellations at each cluster solution was computed to obtain the optimal number of clusters. H. The overlap degree between the maximum probability maps (MPM) yielded by anatomical and RSFC based parcellations was calculated and used to provide a complementary reference for determining the number of clusters. I. Statistical tests were used to detect significant overlap between the structural and functional connectivity‐based parcellations of the RIPL. The negative logarithm of the statistical P‐values was calculated and the biggest negative logarithm of the P‐values was considered to be the optimal overlap across all the subjects. J. Anatomical and RSFC patterns‐based parcellation approached were used separately to define the subregions. In this way the optimal five‐way parcellation of the RIPL and the MPM for each subregion were calculated. The overlap of the MPMs yielded by the anatomical and RSFC‐based parcellations was obtained and used to guide the subsequent analyses. K. The anatomical, RSFC, and task‐related coactivation patterns for each RIPL subregion were mapped to identify the cortical network in which each subregion participated. L. A functional characterization, obtained using a meta‐analysis of data from the BrainMap database, was used to determine the main functions for each RIPL subregion. [Color figure can be viewed at http://wileyonlinelibrary.com]