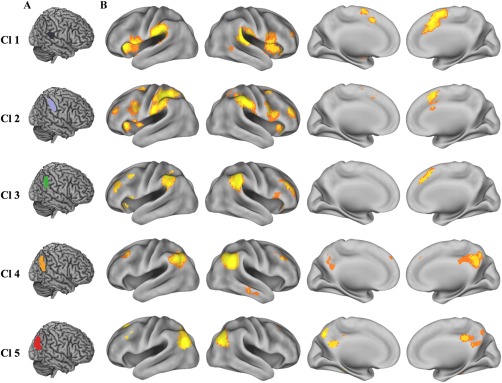
Figure 4.

Overlapping connectivity between the resting‐state functional and coactivation connectivities. A. Each subregion of the RIPL was overlaid on the structural template. B. The intersection connectivity was calculated using the whole brain resting‐state functional and coactivation connectivities. We first obtained thresholded (thresholded at P < 0.05, cluster‐level FWE‐corrected, cluster‐forming threshold at voxel‐level P < 0.001) whole brain resting‐state functional connectivity and coactivation connectivity maps of each right inferior parietal lobule (RIPL) subregion and then computed the intersection connectivity between the two modalities. [Color figure can be viewed at http://wileyonlinelibrary.com]
