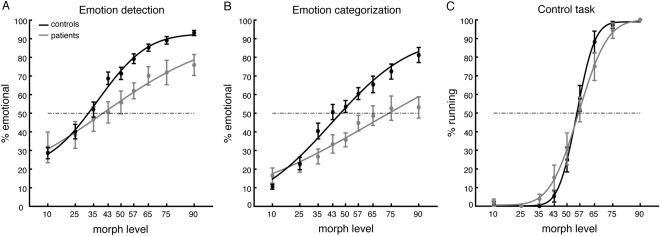
Figure 3.

Behavioral performance. Percent emotional responses (± SEM) as a function of morph level for the emotion detection task (A), the emotion categorization task (B), and the control task (C). Solid lines indicate the fit of the psychometric curve.
