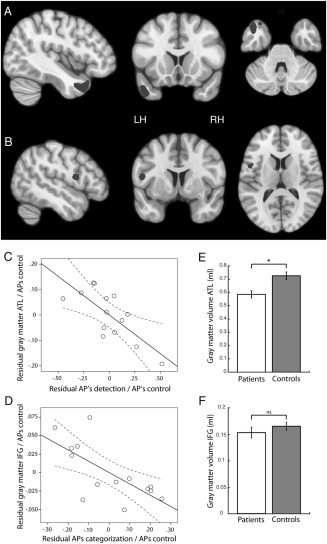
Figure 4.

Brain regions showing a significant correlation between (A) patients' APs in the emotion detection task and gray matter volume and (B) patients' APs in the emotion categorization task and gray matter volume. Volumes are shown at P < 0.01 uncorrected for illustration purposes. (C) Partial correlation between gray matter volume of the ATL ROI and the detection APs, when correcting for the influence of the APs obtained in the control task. (D) Partial correlation between gray matter volume of the IFG ROI and the categorization APs, when correcting for the influence of the APs obtained in the control task. (E) Comparison of gray matter volume in the ATL ROI (P < 0.01) between patients and controls. (F) Comparison of gray matter volume in the IFG ROI (P = 0.33) between patients and controls.
