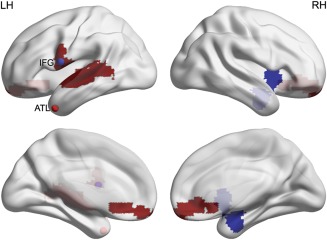
Figure 5.

Resting state analysis. Red and blue spheres illustrate the ATL and IFG ROIs shown in Figure 4. Red and blue voxels exhibit significantly (P < 0.001 uncorrected at P < 0.05 FWE cluster size correction) reduced functional connectivity between the ATL ROI and the rest of the brain, and the IFG ROI and the rest of the brain, respectively. [Color figure can be viewed at http://wileyonlinelibrary.com]
