
Figure 4.
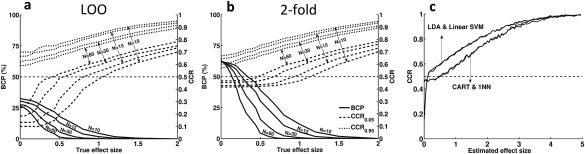
The effect of sample size, effect size, and classifier type on cross‐validated classification rates. (A) BCP, CCR0.05, and CCR0.95 as a function of true effect size and sample size for LDA with LOO cross‐validation. BCP is indicated on the left vertical axis, CCR0.05 and CCR0.95 on the right. (B) BCP, CCR0.05, and CCR0.95 as a function of true effect size and sample size for LDA with twofold cross‐validation. (C) Classification results for three parametric linear and two nonlinear classifiers using LOO cross‐validation. Linear classifiers show classification rates considerably below the chance level for small effect sizes, whereas the other two classifiers do not exhibit this phenomenon.