
Figure 7.
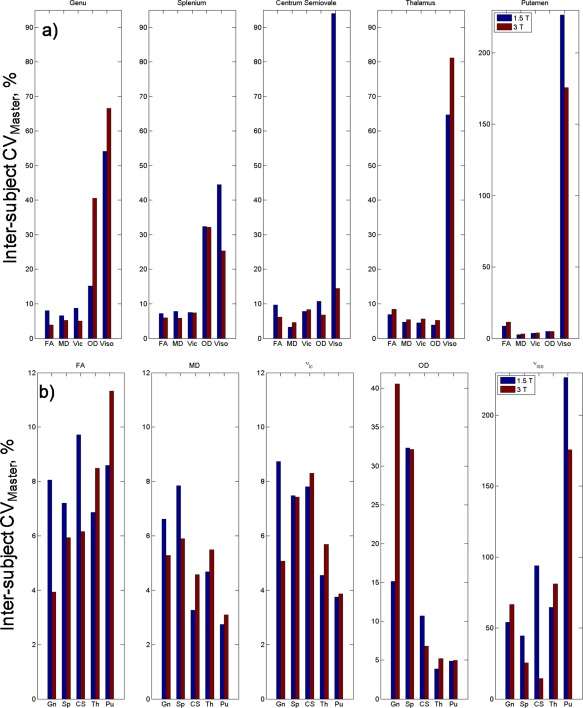
Between‐subject coefficient of variation calculated from the master dataset for each (a) diffusion measure grouped by ROI and (b) ROI grouped by diffusion measure at 1.5 and 3 T. Gn, Genu; Sp, Splenium; CS, Centrum semiovale; Th, Thalamus; Pu, Putamen. [Color figure can be viewed at http://wileyonlinelibrary.com]