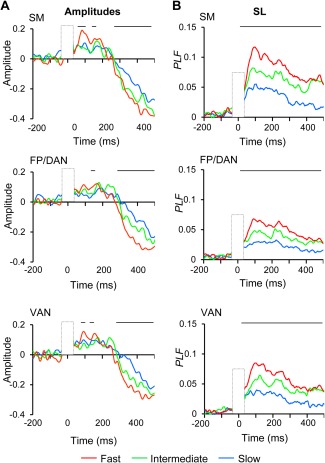
Figure 4.

The strengths of broad‐band amplitude and SL are correlated with RTs. A) Oscillation amplitudes averaged over SM, FP/DAN, and VAN separately for trials with fast, intermediate, and slow RTs. Lines above indicate significant difference between fast and slow RT trials (Wilcoxon signed ranked test, P < 0.05, corrected) B) SL as in A.
