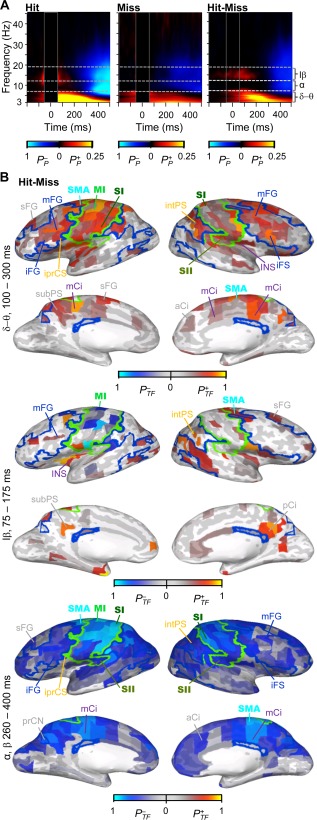
Figure 6.

Spectral characteristics of induced amplitude modulations. A) TFR of the oscillation amplitude modulations for Hits, Misses and for their difference. The color scale shows the fraction of brain areas in which amplitudes were positively (P+ P) or negatively ( ) modulated (Wilcoxon signed rank test, P < 0.05, corrected). B) The cortical areas in which oscillation amplitudes were stronger for Hits than for Misses. Color indicates positive ( ) or negative ( ) fraction of time‐frequency elements in which modulation was observed in the selected TF‐ROI (Wilcoxon signed rank test, P < 0.05, FDR corrected). For labels, borders, and acronyms see Figure 1B.
