
Figure 2.
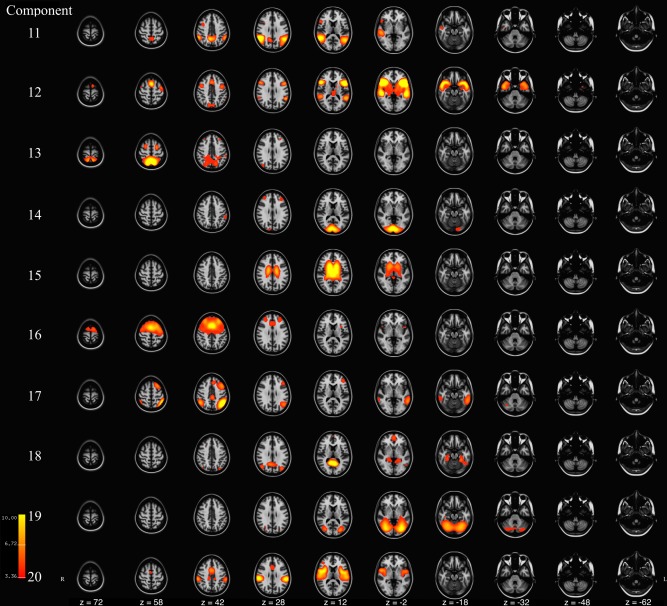
Axial slices of components 11‐to‐20 resulting from meta ICA of 500 repeated ICA samples. Components are thresholded at z = 3.09 (P < 0.001). Component Labels: 11 = Precuneus, 12 = Lateral Frontal, 13 = Parietal, 14 = Visual, 15 = Ventricular, 16 = Executive Control, 17 = Left Frontoparietal, 18 = Default Mode Network II, 19 = Cerebellar‐Occipital, 20 = Insular. [Color figure can be viewed at http://wileyonlinelibrary.com]