
Figure 5.
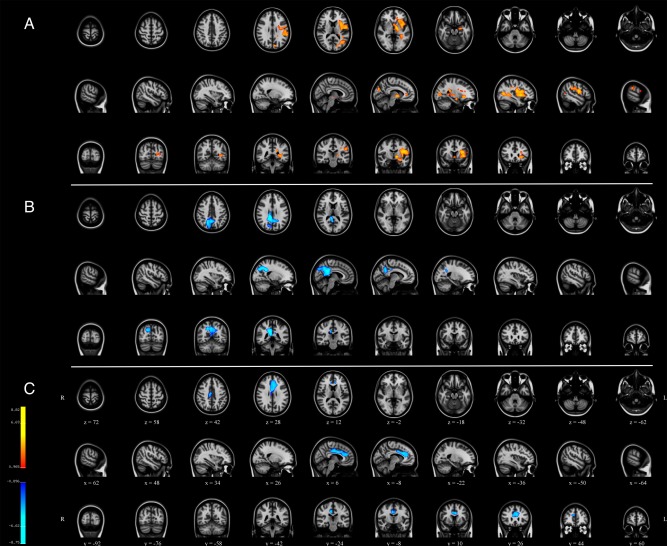
Within‐network associations with age using spatiotemporal regression. Clusters are t‐values indicating significant association at P corrected < 0.05, with red indicating a positive association with age and blue indicating a negative association with age. (a) meta‐ICA component 3/right frontoparietal, (b) meta‐ICA component 1/default mode network, and (c) meta‐ICA component 16/executive control network. [Color figure can be viewed at http://wileyonlinelibrary.com]