
Figure 2.
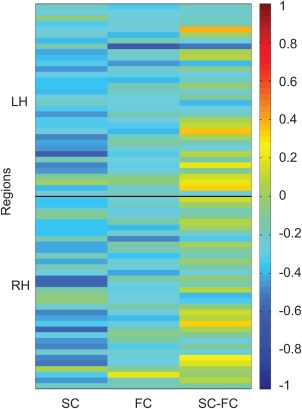
Univariate summary of regionwise connectivity with aging. The first, second, and third columns demonstrate regionwise SC correlations with age, FC with age, and SC–FC with age, respectively. The 68 Desikan Killiany regions along the y‐axis are in the order described in Supporting Information, Table SI: 34 left hemisphere regions first, and 34 right hemisphere regions second. SC (column 1) and FC (column 2) decrease with age, whereas SC–FC coupling (column 3) changes in variable ways during aging, depending on region. This correlation matrix is then analyzed in PLS to obtain the two patterns described in Figures 3 and 4 that characterize the relationship between brain connectivity and age. [Color figure can be viewed in the online issue, which is available at http://wileyonlinelibrary.com.]