
Figure 2.
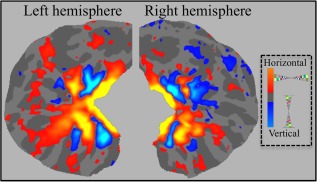
Average of retinotopic activation across subjects. Average retinotopic activation of 10 subjects is projected onto the Freesurfer average occipital surface. Hot and cold colors represent horizontal and vertical meridian activations, respectively. [Color figure can be viewed in the online issue, which is available at http://wileyonlinelibrary.com.]