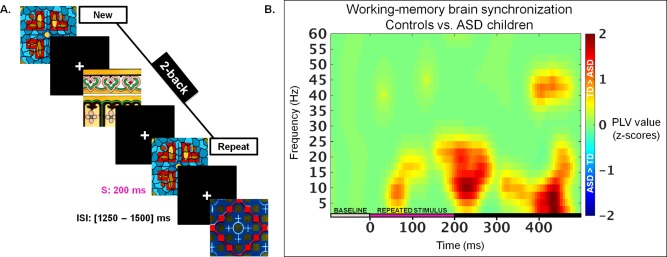
Figure 1.

A: The N‐back task. Schematic of the 2–back condition where the child is required to recognize that an image (Repeat) is the same as two images before (New; first occurrence of a picture). Each image (stimulus, S) appeared for 200 ms and was followed by a fixation cross displayed with an ISI varying between 1250 and 1500 ms to reduce anticipation of the next trial. B: Differences in WM‐related brain synchronization processes between groups. Differences of averaged PLV values (inter‐regional brain synchrony; z‐scores; P < 0.05) between children with ASD and TD children across time and frequencies from which were selected the time windows and frequency bands of interest that were submitted to the nonparametric Network Based Statistic (NBS) toolbox.
