
Figure 3.
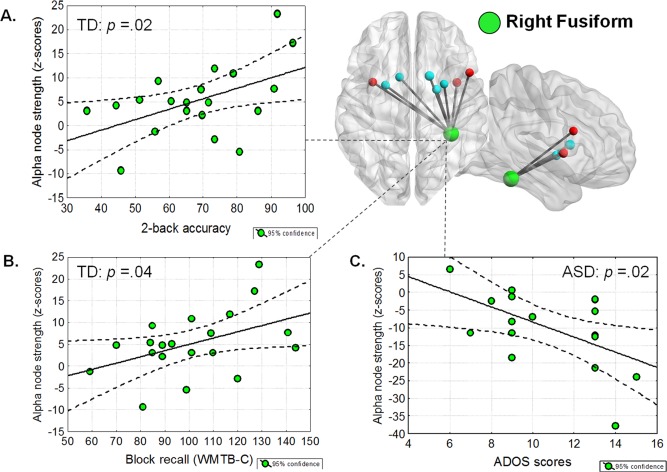
Correlation analyses. Significant correlation coefficients (all P < 0.05) between connectivity processes (alpha node strength; z‐scores) related to the right fusiform and WM performance (accuracy) in (A) the 2–back task (average r = + 0. 49; P = 0.02 in TD children vs. r = + 0. 09; P = 0.73 in ASD children and in (B) the block recall subtest of the Working Memory Test Battery for Children (WMTB‐C) (average r = + 0. 44; P =0.04 in TD children vs. r = −0. 23; P =0.38 in ASD children. C: Significant correlation coefficient (P < 0.05) between connectivity processes (alpha node strength; z‐scores) related to the right fusiform and symptoms severity in ASD.