
Figure 2.
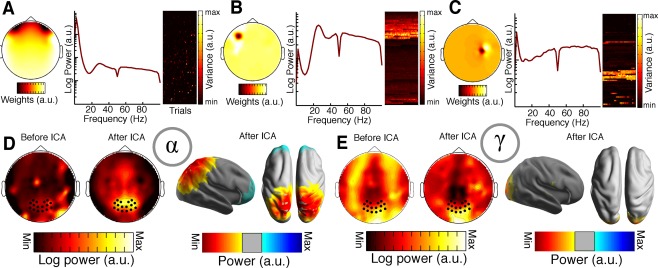
ICA artefact rejection procedure. (A–C) Various components that were classified as artefacts, based on their topography, broadband power distribution in frequencies greater than 30 Hz and their variance in power over trials [Hipp and Siegel, 2013]. Individual components were rejected after visual inspection. Each subplot depicts the sensor‐level topography (left), the power spectrum (middle), and the variance of the component time course over trials (right). Component variances are grouped sequentially for each trial from the upper left to the lower right. (D) The effects of cleaning on sensor and source level power are depicted as grand averages. Left: Sensor level topography of average alpha power across subjects before and after ICA cleaning. Right: Source space projection of average alpha power across subjects after ICA cleaning. (E) ICA cleaning effects on gamma power for sensor (left) and source (right) estimates. Note that the scaling is different for the ICA plots before and after cleaning.