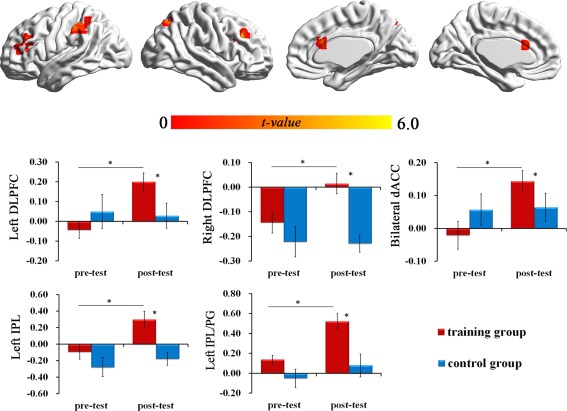
Figure 4.

Increased activity (post‐test minus pre‐test) during the fMRI tasks. (A) Brain areas that showed increased activity in the TG. Significant levels for correction were set at P < 0.05, small volume corrected. (B) Bar charts displayed the average amount of activation or deactivation. [Color figure can be viewed in the online issue, which is available at http://wileyonlinelibrary.com.]
