
Figure 1.
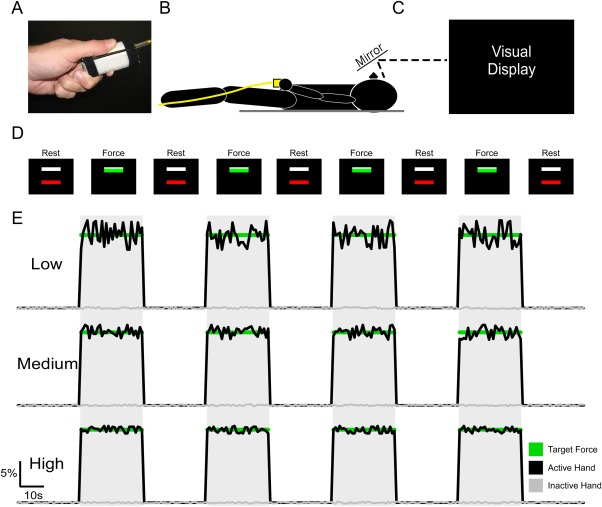
Experimental Setup. The force transducer was held between the thumb and the index finger by the subject during the MRI session (A), and the subject laid in the supine position in which the hand and transducer rested at the lower trunk (B). Above the field of view of the subject was a mirror, which reflected the visual display (C). The visual display instructed the subject when to produce force. The subject initially saw two bars (one red, one white) on the black screen, which indicated the “Rest” condition. The white bar was set at 15% of each subject's MVC. Following the 30 s Rest condition, the red bar would turn green which indicated the “Force” condition. Subjects were instructed, which hand to use before the task began, and to produce no force with their other hand. During the force condition, the goal was to produce 15% MVC, which would cover the white bar so that it was not visible. Following the Force condition, the trial was repeated. This was repeated four times for each gain level, and for each hand. E: Example data is shown for each gain level. Force data corresponds with the visual display instructions shown in D. The green line represents 15% MVC, the black line represents force data for the hand used in the task, and the gray line represents force data for the hand not used in the task.