
Figure 2.
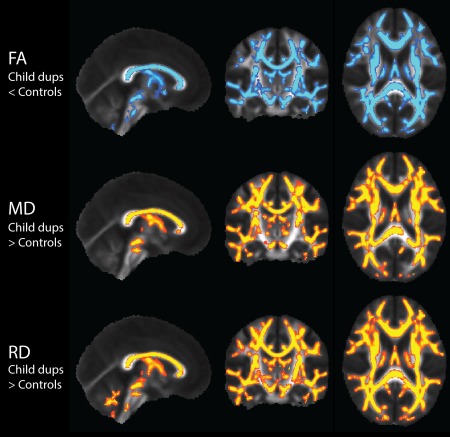
DTI TBSS results in the pediatric 16p11.2 duplication carriers (n = 13) compared to controls (n = 34), with nuisance regression of site, age, and gender. Results show white matter regions with significantly decreased FA displayed in blue, and significantly increased MD and RD displayed in yellow (p < 0.0083). AD also demonstrates elevations in spurious voxels. There were no significant results in any of the remaining pediatric duplication carrier vs pediatric control contrasts. [Color figure can be viewed in the online issue, which is available at http://wileyonlinelibrary.com.]