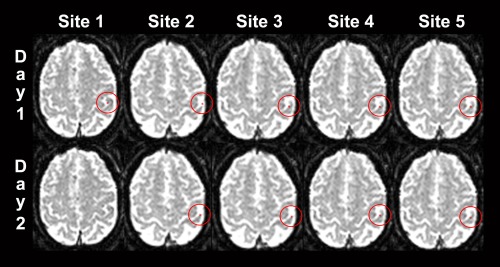
Figure 1.

Example of the somatosensory variability of functional localizations (center of mass COM = red voxel). Data of a single subject with median variability of 3.9 mm (between‐site) and 2.4 mm (within‐site). The COM is projected on the respective axial functional echo‐planar image of the reference site (left is right). The COM position is shown for the five sites and the two measurements at each site (day 1 and day 2). Note that the COM‐slices and the COM‐within‐slice‐positions change only slightly. At site 1, day 2 no data survived thresholding.
