
Figure 3.
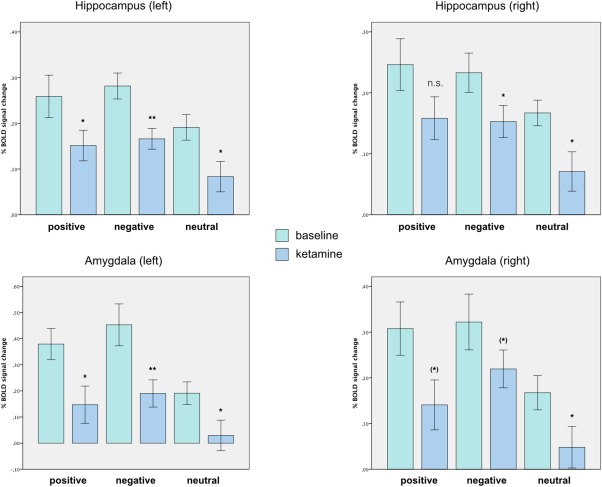
Reduced BOLD reactivity to positive, negative, and neutral stimuli in the bilateral amygdala and hippocampus (extracted using AAL MNI ROI library and Marsbar SPM8 ROI toolbox). Bars indicate task‐specific %‐BOLD signal changes (positive, negative, and neutral) for the baseline (green) and ketamine (blue) session (paired t test, n = 23, error bars: ±SEM). [Color figure can be viewed in the online issue, which is available at http://wileyonlinelibrary.com.]