
Figure 3.
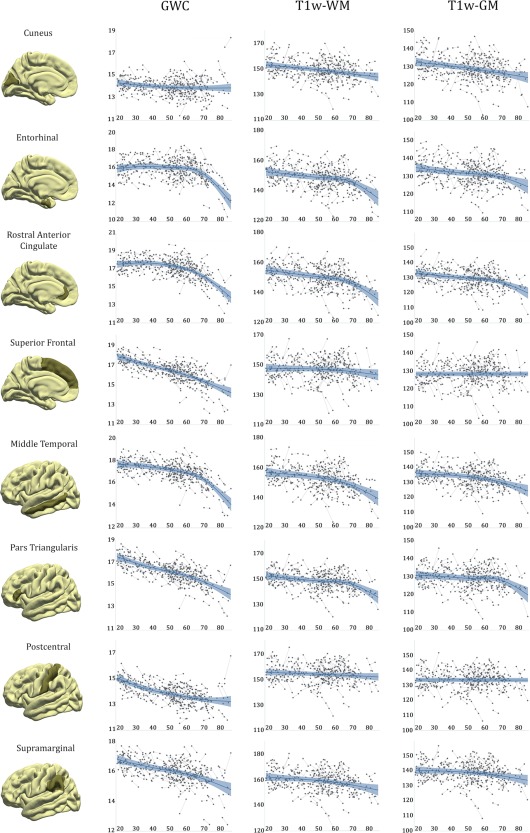
Spaghetti plots of contrast and signal intensity. Spaghetti plots of contrast and signal intensity for representative bilateral regions as a function of age. For each region, the blue line represents the GAMM fitting while the lighter blue area corresponds to its confidence interval.