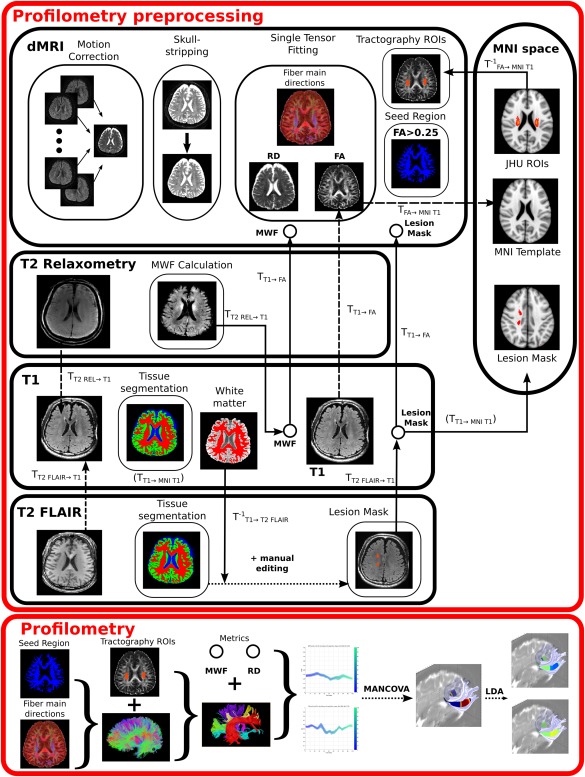
Figure 1.

Pipeline framework required for profilometry analysis. Profilometry preprocessing involved several steps. For dMRI it includes motion‐correction, skull‐stripping, tensor fitting (notably to compute FA and RD metrics), seed region creation [voxels having FA > 0.25)] and tractography ROIs creation in native space from MNI space ROIs. For T2 Relaxometry it mainly involves the calculation of the MWF map and its registration to dMRI native space. The lesion masks were created from both T1 and T2 FLAIR as detailed in the manuscript and illustrated here. Finally the “profilometry proper” included tractography and tract parcellation, as according to the preprocessed data, and feeding the resulting tract metric profiles into the statistical procedure composed of the MANCOVA and LDA analyses. Transformations calculated from one space to another are indicated in dashed lines. The use of these transformations (or their inversed) is represented in solid lines. Please note that the T1 → MNI T1 transform was obtained from the T1 tissue segmentation step, and thus indicated as such in the diagram.
