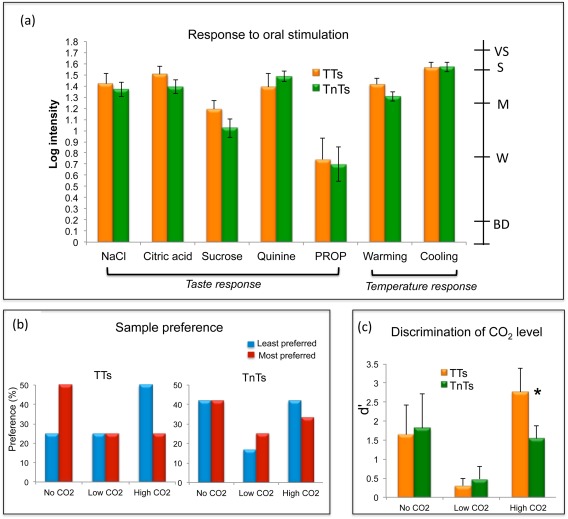
Figure 2.

Behavioural response: (a) Intensity of oral responses perceived by the thermal taster (TT) and thermal non‐taster (TnT) group. Secondary scale indicates labels on the gLMS: BD = barely detectable, W = weak, M = moderate, S = strong, VS = very strong. (b) Percentage of subject's preference by each group. (c) The discrimination ability of subjects to correctly identify the CO2 level delivered during the fMRI scan session, with the d’ value of the TT and TnT group provided. Asterisks indicate a significant difference between groups at P < 0.05. Error bars show standard error. [Color figure can be viewed in the online issue, which is available at http://wileyonlinelibrary.com.]
