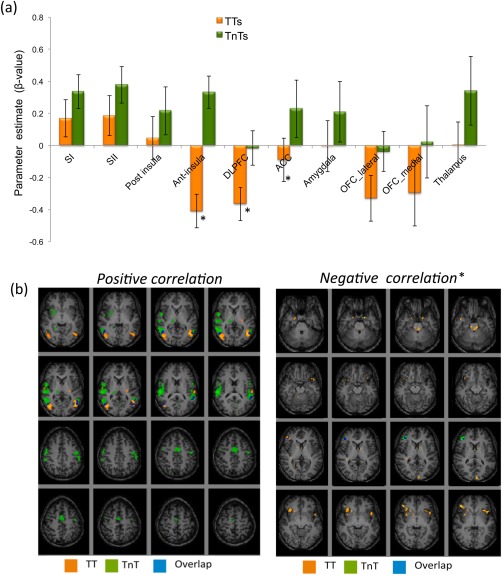
Figure 4.

(a) Positive and negative parameter estimate (β‐value) for TT and TnT groups in a priori cortical areas (error bars indicate the standard error). Asterisks indicate a significant difference between groups at P < 0.05. (b) Cortical areas showing a positive and negative correlation with CO2 level. Maps displayed with P < 0.005, * P < 0.05 uncorrected. In each figure the TT group is shown in orange, the TnT group in green, and the overlap of these groups in blue. [Color figure can be viewed in the online issue, which is available at http://wileyonlinelibrary.com.]
