
Figure 2.
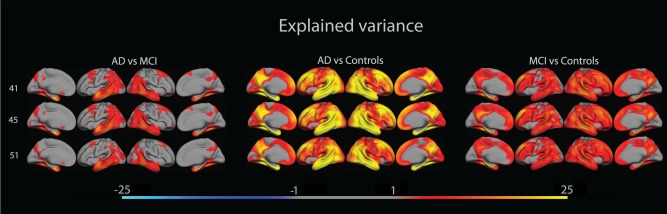
The figure shows amount of variance in cortical thickness that is explained by patient group, overlaid on lateral and medial views of the left and right hemisphere of an average brain (fsaverage). [Color figure can be viewed in the online issue, which is available at http://wileyonlinelibrary.com.]