
Figure 3.
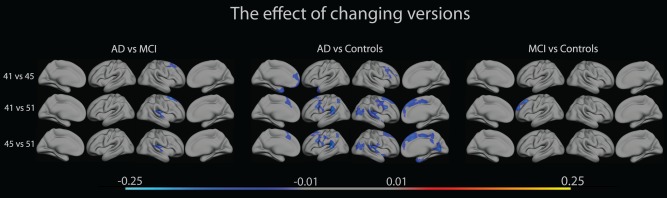
The figure shows interactions between diagnostic group (AD, MCI, NC), and absolute percentage differences between FreeSurfer versions 4.1.0, 4.5.0 and 5.1.0, overlaid on lateral and medial views of the left and right hemisphere of an average brain (fsaverage). [Color figure can be viewed in the online issue, which is available at http://wileyonlinelibrary.com.]