
Figure 4.
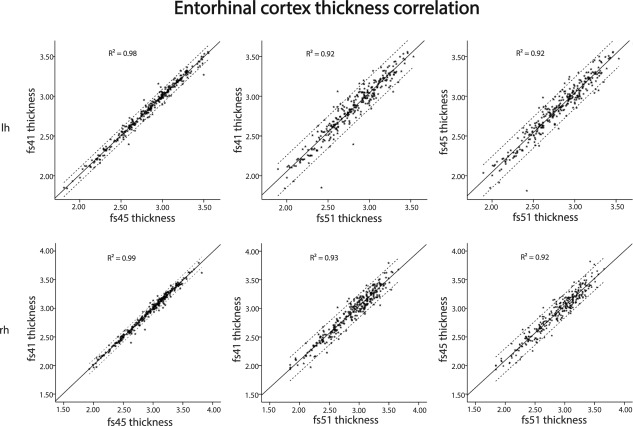
The figure shows correlation (95% confidence intervals) of values of entorhinal thickness between FreeSurfer versions 4.1.0, 4.5.0 and 5.1.0, overlaid on lateral and medial views of the left and right hemisphere of an average brain (fsaverage).