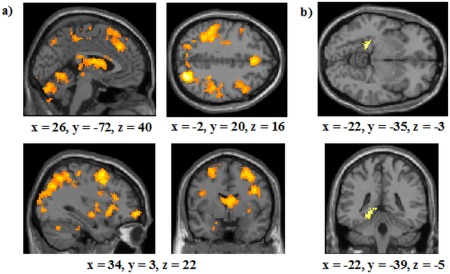
Figure 7.

Analysis of participants who were shown by the modeling analysis to use the optimal learning strategy overall for all runs of the study: (a) Areas commonly activated in the RB condition and the II condition (with thresholds of P < 0.001 and 27 contiguous voxels); (b) A ROI analysis of areas of the MTL more activated in the II condition compared with the RB condition (with thresholds of P < 0.05 and 79 contiguous voxels). The right most image represents the brain from the bottom. The coordinates indicate the origin for the image displayed. Lighter colors indicate higher z‐scores. [Color figure can be viewed in the online issue, which is available at http://wileyonlinelibrary.com.]
