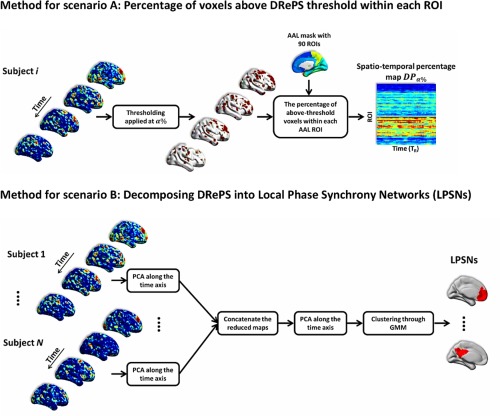
Figure 2.

Two scenarios for analysis of DRePS maps: (A) voxels with the most significant DRePS values within each 3D ROI were counted leading to a spatio‐temporal DRePS percentage map, (B) reduced DRePS feature vectors were spatially clustered using Gaussian Mixture Modeling (GMM) resulting in communities of local oscillators in fMRI data called local phase synchrony networks (LPSNs). [Color figure can be viewed in the online issue, which is available at http://wileyonlinelibrary.com.]
