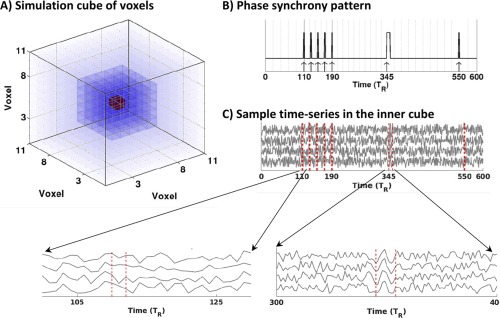
Figure 3.

Simulated data: (A) 3D arrangement of voxels in the simulated data. The inner compartment of time series with phase synchrony pattern has been highlighted with greater opacity. The central voxel has been shown in red, (B) phase synchrony pattern , C) four representative time‐series extracted from the inner cube. [Color figure can be viewed in the online issue, which is available at http://wileyonlinelibrary.com.]
