
Figure 4.
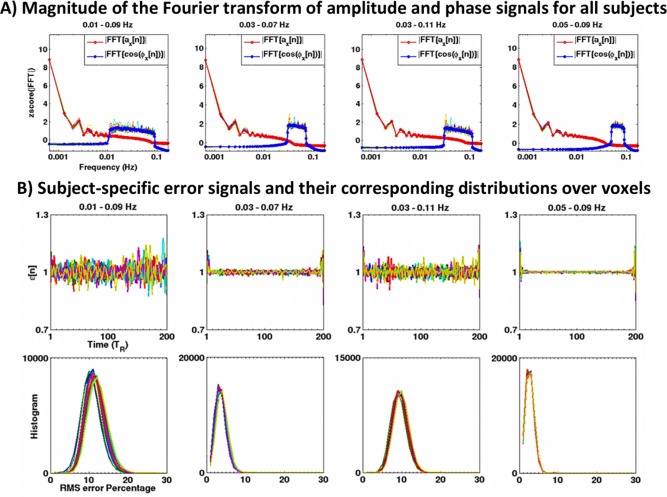
(A) Bandwidths of the low‐pass and high‐pass components of analytic associates [see Eq. (1)] averaged over voxels of each subject. Each subject‐specific curve is illustrated with a single color and the grand mean spectra are shown in bold. The y‐label zscore(|FFT|) means the magnitude of the Fourier transform converted into the z‐score over frequency bins (zero mean and unit variance). Whilst the wider bands exhibit a smaller separation between the low‐pass and high‐pass components compared to the narrower bands, Bedrosian's requirement still remains satisfied. (B) Subject‐specific averages of the error signal over all voxels for the analytic associates of fMRI data within four frequency bands (top row) and their corresponding distributions of the RMS of their deviation from one (bottom row). In all panels, each subject‐specific curve is illustrated with a unique color. [Color figure can be viewed in the online issue, which is available at http://wileyonlinelibrary.com.]