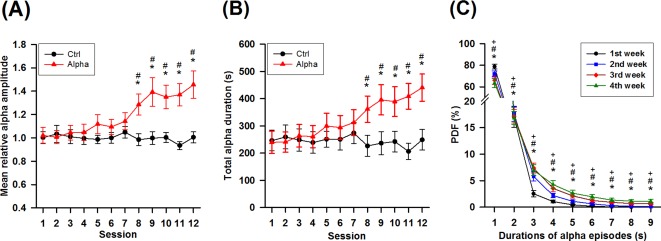
Figure 5.

Dynamic changes of alpha rhythm throughout NFT. (A) Changes of mean relative alpha amplitude throughout 12 sessions in the two groups. *P < 0.05 versus 1st session, # P < 0.05 versus Ctrl. (B) Changes in the total alpha duration throughout 12 sessions in the two groups. *P < 0.05 versus 1st session, # P < 0.05 versus Ctrl. (C) Changes in the probability density function (PDF) of durations of alpha episodes per week in the Alpha group. *P < 0.05 2nd week versus 1st week. # P < 0.05 3rd week versus 1st week. + P < 0.05 4th week versus 1st week. All multiple comparisons are Bonferroni corrected. [Color figure can be viewed in the online issue, which is available at http://wileyonlinelibrary.com.]
