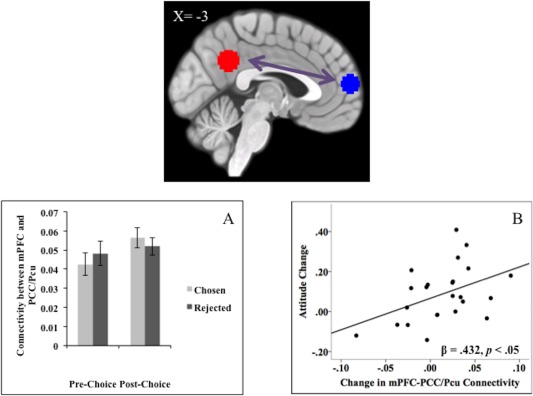
Figure 2.

Functional connectivity between mPFC and PCC/Pcu ROIs: connectivity increased for chosen options and predicted changes in attitudes toward the chosen options after the choice. (A) The figure represents activation relative to implicit fixation baseline, with error bars representing standard error for each condition. (B) The figure shows change in appraisals of the chosen options as a function of the change in connectivity between mPFC and PCC/Pcu. [Color figure can be viewed at http://wileyonlinelibrary.com.]
