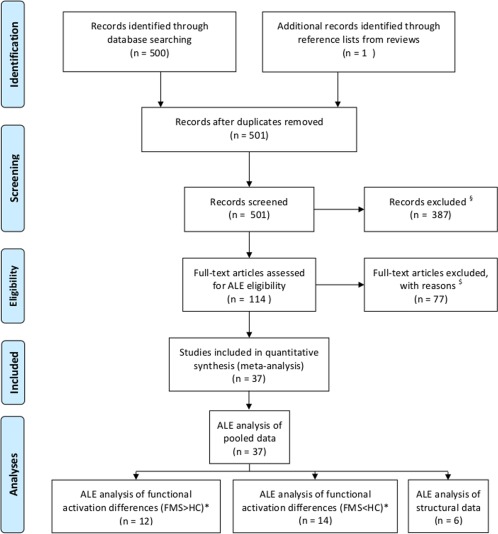
Figure 1.

Show the sequence of the literature search and the process of inclusion or exclusion of articles according the PRISMA statement (see http://www.equator-network.org/reporting-guidelines/prisma/). §exclusion criteria = no brain imaging, single case reports, reviews. $exclusion criteria = no statistical comparison of groups, no whole‐brain analysis, no standard stereotactic space coordinates (Talairach, MNI). * some articles show results of clusters with hyperactivation or hypoactivation. For each subanalysis these clusters were integrated separately. [Color figure can be viewed in the online issue, which is available at http://wileyonlinelibrary.com.]
