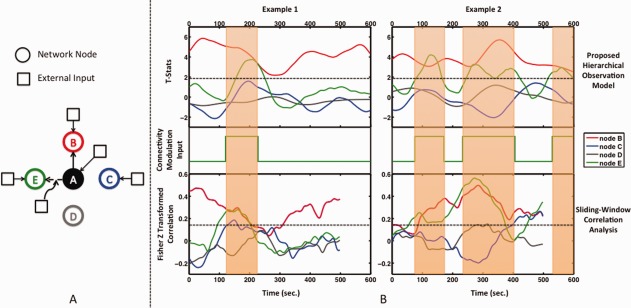
Figure 2.

(A) Simulation dataset network topology based on [Smith et al., 2011]. Functional Node A is modeled to have a stationary connection with functional Node B and no connection to nodes C and D, where node C is receiving neural inputs to model a functional node, and node D only receives noise inputs to model a non‐functional node. The connection between node A and functional node E is modeled as a dynamic connection as determined by an external modulation input. (B) Examples of dynamic functional connectivity as determined by our hierarchical observation model (top) and sliding‐window correlation analysis (bottom) (window width = 90 sec), with the corresponding external input modulating the connection strength between node A and node E at the neural level (middle). The state transition of this input modulates the functional connectivity between the nodes at the neural level. Connection variability with a standard deviation of 1/20 of the state difference is applied. This is propagated through the network based on DCM modeling and then translated to a BOLD signal through the balloon model of the hemodynamic response function. The resulting BOLD signal is sampled every 3 sec. The stationary connection of node B is determined to be statistically significant (t > 1.96) at all time points using our approach, while sliding‐window correlation coefficients vary to near zero values. The connection of node E is determined to be statistically significant and in phase with the external modulation input. Note that dynamic connectivity estimated by sliding‐window correlation analysis has fewer time points than the actual BOLD signal due to windowing effect. However, the correspondence between dynamic connectivity time points and BOLD signal is obtained by shortening the window width toward the beginning and end of the BOLD signal in our proposed technique. [Color figure can be viewed at http://wileyonlinelibrary.com]
