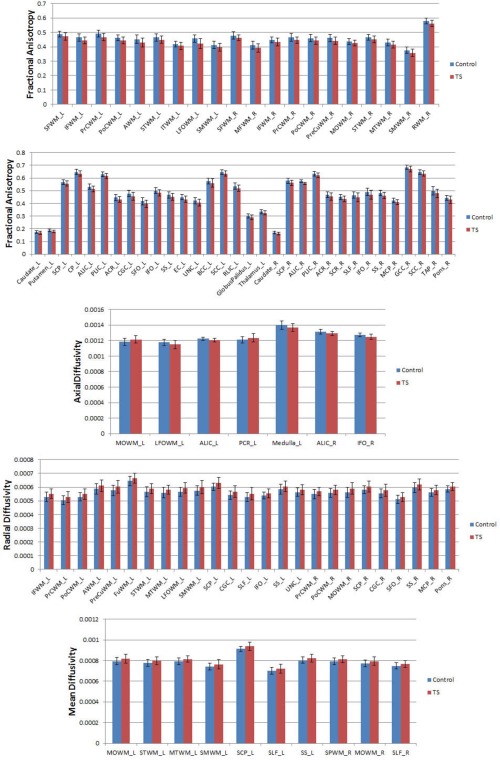
Figure 5.

Significant differences in diffusion measures (P < 0.05) using atlas‐based analysis of TS and control groups. This figure shows the mean FA, AD, RD and MD from ROI for TS (red) and control (blue) groups. Values represent mean ± standard deviation. Abbreviations of ROIs are in Tables I and II. [Color figure can be viewed in the online issue, which is available at http://wileyonlinelibrary.com.]
