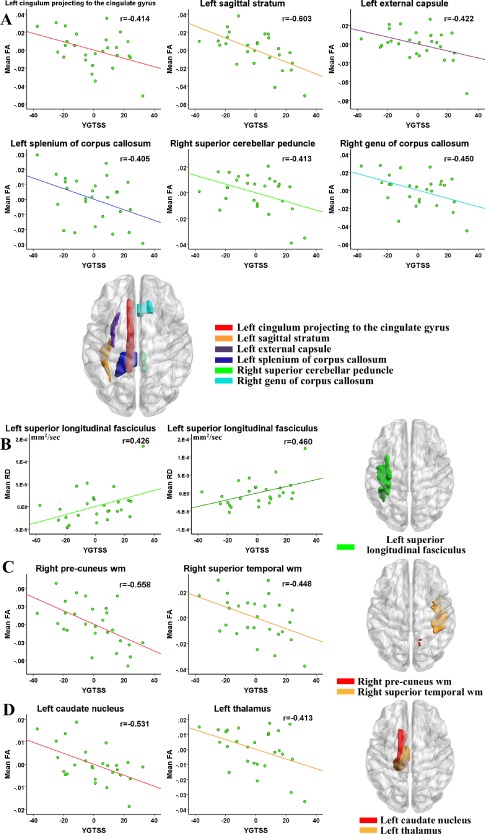
Figure 7.

Atlas‐based correlation analysis in deep white matter tracts (DWMT), superficial white matter regions (SWMR) and different nuclei. (A) Significantly negative correlation between YGTSS and mean FA value in DWMT. (B) Significantly positive correlation between YGTSS and mean RD and MD value in DWMT. (C) Significantly negative correlation between YGTSS and mean FA value in SWMR. (D) Significantly negative correlation between YGTSS and mean FA value in left caudate nucleus and thalamus. Of note, the X‐axis and Y‐axis only reflect the partial correlation of DTI parameter and YGTSS, while considering age and gender as covariables. [Color figure can be viewed in the online issue, which is available at http://wileyonlinelibrary.com.]
