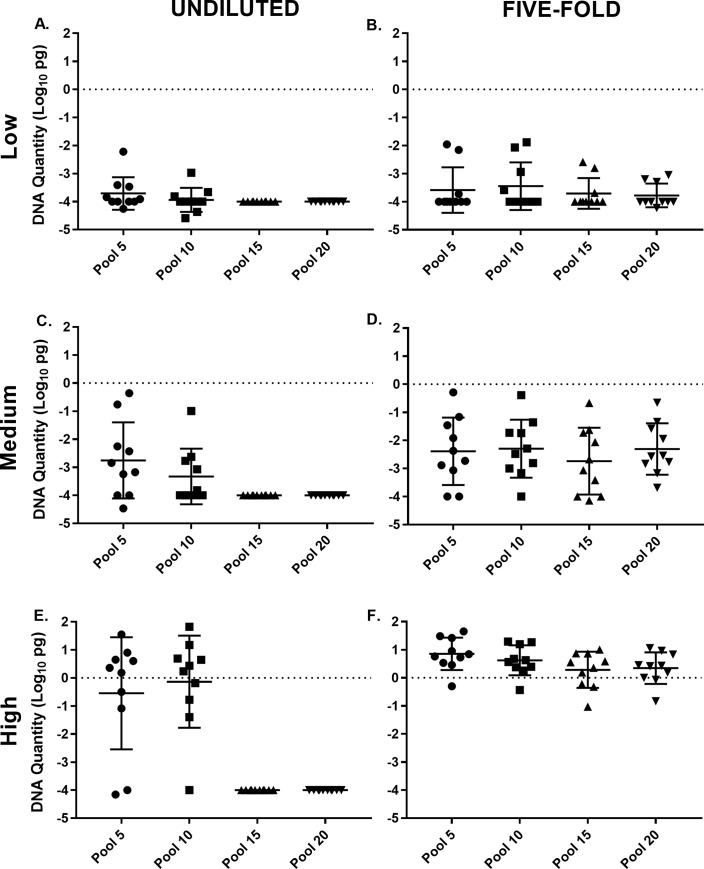
Fig 2. Scatter plots of the log transformed Mycobacterium avium subsp. paratuberculosis (Mptb) mean DNA (± SD) quantities detected in qPCR for each pool size.
The undiluted DNA extract of the Low, Medium, and High Mptb shedding group (A, C, and E). The five-fold dilution of the undiluted DNA extract of the Low, Medium and High Mptb shedding group (B, D, and F). Note the lack of DNA detection for the undiluted DNA extract at pooling rates of 15 and 20 for the Low, Medium and High Mptb DNA shedding groups.

