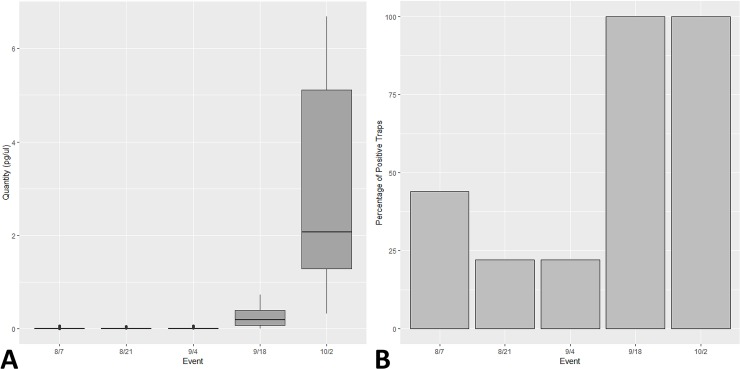
Fig 3. Bouteloua eDNA increased over time in correspondence with pollination events.
(A) The quantity of Bouteloua eDNA over the course of five sampling events across all nine BSNE traps. Boxes extend to the upper and lower quartile range while showing the median as dark solid line. Whiskers extend to the 95% confidence interval of the data and outliers are represented by circles. (B) The percentage of BSNE dust traps that detected a significant amount of Bouteloua airborne eDNA. The Bouteloua genus eDNA was detected 44, 22, 22, 100, and 100 percent of the time for events 1,2,3,4, and 5 respectively.

