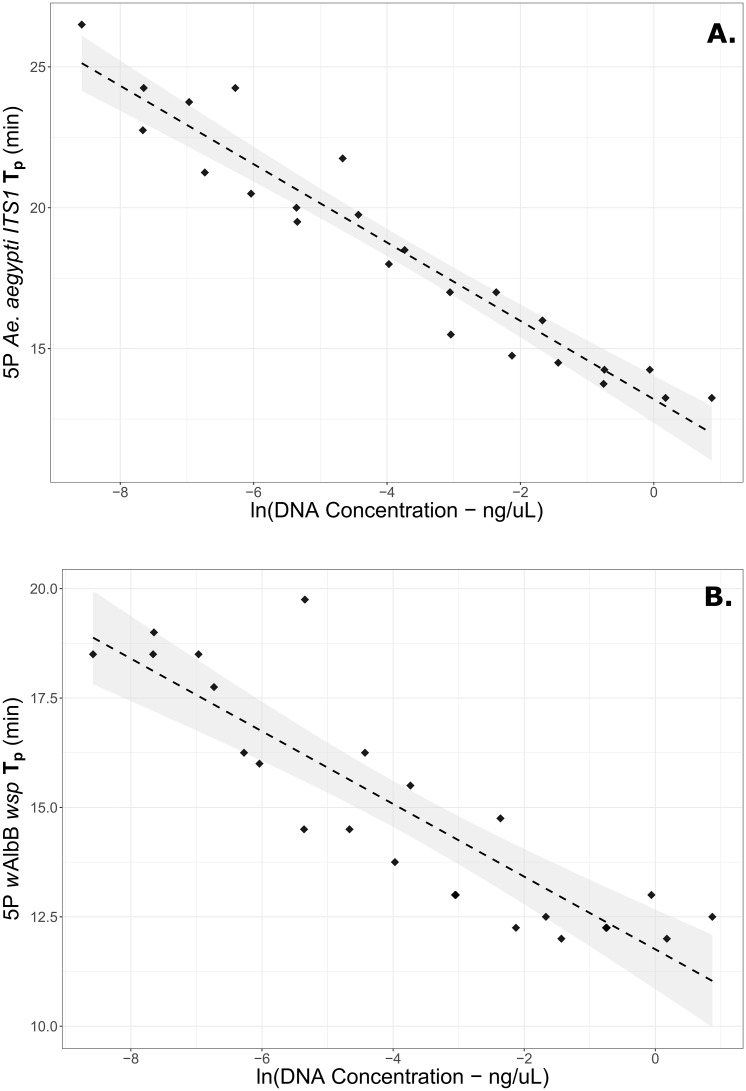
Fig 1. Concentration curves for (A) Ae. aegypti ITS1 & (B) wAlbB wsp LAMP 5-primer sets (i.e. the forward loop primer of each has been removed).
The horizontal axis shows the natural log of overall extracted DNA in the samples, while the vertical axis shows the peak amplification time (Tp) for each primer set under fresh reagent conditions. Linear regression lines are shown with 95% confidence intervals shaded.

