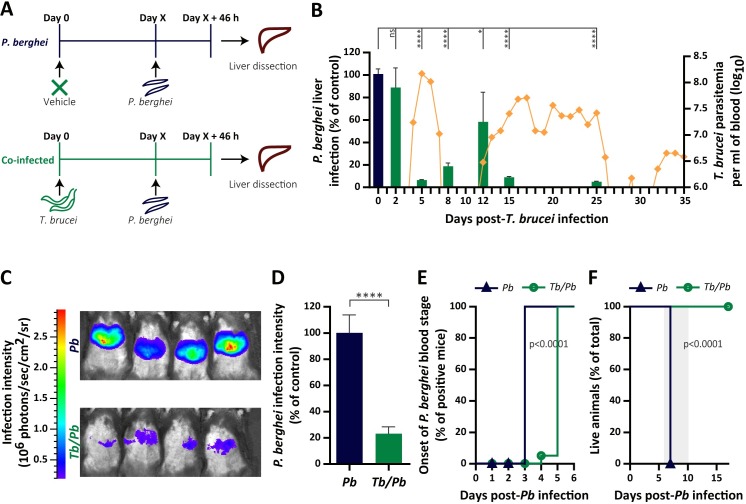
Fig 2. T. brucei attenuates hepatic infection by P. berghei.
(A) Schematic illustration of the co-infection experimental design. The arrows indicate the times of T. brucei and/or P. berghei inoculation, and of liver dissection for quantification of P. berghei liver load. (B) P. berghei liver infection load (bars–primary YY axis) determined by qRT-PCR 46 h after sporozoite injection into naïve mice (blue bar) or mice previously infected by T. brucei (green bars), and T. brucei parasitemia (dots–secondary YY axis) determined daily by microscopy. All P. berghei infections were performed on the same day, with prior T. brucei infections staggered to give a consistent day for subsequent P. berghei infection. The time points indicated on the XX-axis correspond to the number of days that elapsed between T. brucei inoculation and sporozoite injection. Bars represent the mean values of two independent experiments and error bars indicate the SEM. The one-way ANOVA with post-test Dunnett was employed to assess the statistical significance of differences between the experimental groups. ns, not significant, * P < 0.05 and **** P < 0.0001. (C) Representative bioluminescence images of mouse livers 46 h after inoculation of 3 x 10⁴ P. berghei sporozoites into either naïve mice (Pb—top) or mice infected 5 days earlier with T. brucei (Tb/Pb—bottom). (D) Quantification of the P. berghei liver infection load measured by bioluminescence 46 h after sporozoite injection into naïve mice (blue bar) or mice previously infected by T. brucei (green bar). Bars represent the mean values of three independent experiments and error bars indicate the SEM. The Mann-Whitney test was employed to assess the statistical significance of differences between experimental groups (**** P < 0.0001). (E) Assessment of P. berghei prepatency period following inoculation of 3 x 10⁴ sporozoites into naïve mice (Pb—blue line) or mice infected 5 days beforehand with T. brucei (Tb/Pb—green line). Percentage of mice displaying P. berghei parasitemia, as measured by flow cytometry. The pooled data from 10 mice employed in two independent experiments is shown The Mantel-Cox (log rank) test was employed to compare the onset of P. berghei parasitemia curves, indicating statistically significant differences for Tb/Pb compared to the Pb control. (F) Mouse survival following inoculation of 3 x 10⁴ P. berghei sporozoites into naïve C57BL/6J mice (Pb—blue line) or C57BL/6J mice infected 5 days earlier with T. brucei (Tb/Pb—green line). Percentage of live mice from a pool of 10 mice employed in two independent experiments. The Mantel-Cox (log rank) test was employed to compare survival curves, indicating statistically significant differences for Tb/Pb compared to the Pb control, and the time window for ECM development is depicted by the grey-shaded area.

