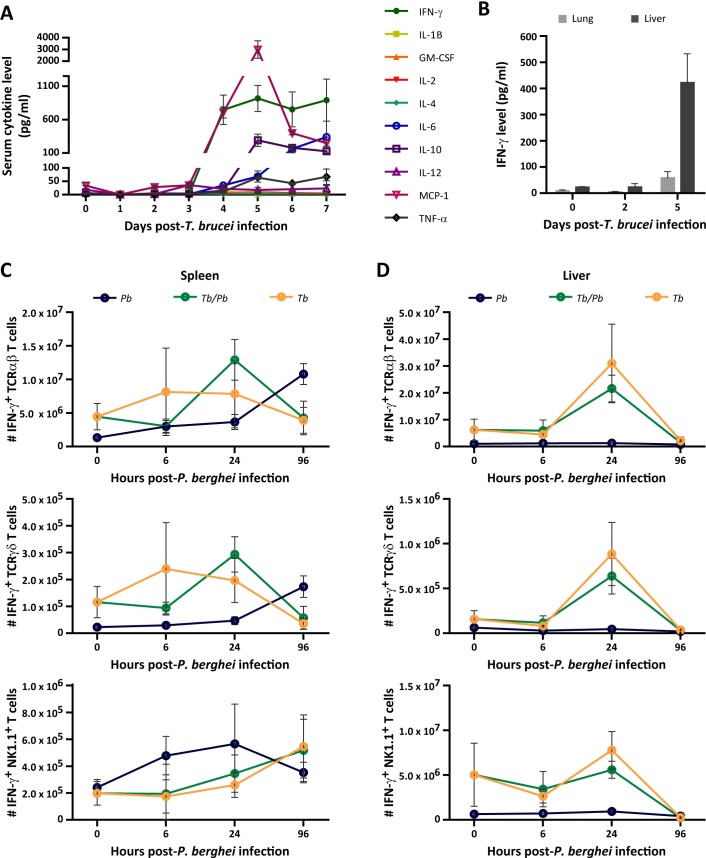
Fig 5. T. brucei elicits a strong immune response systemically and in the liver.
(A) IFN-γ, IL-1B, GM-CSF, IL-2, IL-4, IL-6, IL-10, IL-12p70, MCP-1 and TNF-α quantification in serum by immunoassay from mice non-infected or infected only with T. brucei. The time points indicated on the XX-axis correspond to the days of T. brucei infection. Dots represent the mean values of three to four mice from one independent experiment with error bars indicating the SEM. (B) Quantification of IFN-γ by immunoassay in the lung (light grey bar) and liver (dark grey bar) of both non-infected mice and mice infected for two and five days with T. brucei. The time points indicated on the XX-axis correspond to the days of T. brucei infection. Bars represent the mean values of three to four mice from one independent experiment and error bars indicate the SEM. (C-D) Multi-parameter flow cytometry-based quantification of IFN-γ-producing TCRαβ, TCRγδ and NK1.1+ lymphocytes in the spleens (C) and livers (D) of mice infected only with P. berghei (Pb—blue dots), infected with P. berghei on the fifth day of T. brucei infection (Tb/Pb–green dots) and infected for 5 days only with T. brucei (Tb—yellow dots). The time points indicated on the XX-axis correspond to the time after injection of 3 x 10⁴ P. berghei sporozoites, with 0 h corresponding to day 5 of T. brucei infection. Dots represent the mean values of four mice from one independent experiment with error bars indicating SD.

